Error in train_continuous(): ! Discrete Value Supplied to a Continuous Scale

The error message “error in train_continuous(): ! discrete value supplied to a continuous scale” commonly occurs when using R and its ggplot2 package for data visualization. It generally arises due to a mismatch between the data type and the expected scale in a ggplot graph. Specifically, the error indicates that you’re attempting to map a discrete value (e.g., categories or factors) to a continuous scale, which is designed for numeric data.
Causes of the Error
- Mapping Discrete Data to a Continuous Scale: The primary cause of this error occurs when a factor or character variable (discrete) is incorrectly passed to a function expecting continuous data. For example, if you’re plotting a variable like “day of the week” but mistakenly define it on a continuous scale, this error will surface.
- Improper Use of ggplot2 Functions: Functions like
scale_x_continuous()orscale_y_continuous()are built for numeric data. If these functions are applied to non-numeric values, it causes theerror in train_continuous(): ! discrete value supplied to a continuous scale. In contrast, factors or categorical data should usescale_x_discrete()orscale_y_discrete(). - Unexpected Data Changes: If data is altered, and continuous values are transformed into factors or character strings (such as through data cleaning or aggregation), users might unknowingly plot the data on an incorrect scale, leading to this error.
How the Error Manifests
When users encounter the error, they are typically in the process of plotting a graph in ggplot2. The plot may fail to render, and the message will appear in the console, often leaving users puzzled, especially when they expect their data to be numeric or continuous. Here’s an example of how this error may arise:
library(ggplot2)
data <- data.frame(
  category = factor(c("A", "B", "C")),
  value = c(1, 3, 5)
)

ggplot(data, aes(x = category, y = value)) +
  geom_line() +
  scale_x_continuous()
In the above code, the category variable is discrete, but scale_x_continuous() is used. This mismatch triggers the error in train_continuous(): ! discrete value supplied to a continuous scale.
Real-World Examples and User Feedback
In online forums and communities like StackOverflow, users frequently encounter this error when working with ggplot2. For instance, a user may attempt to visualize sales data where the x-axis consists of months (discrete), but they mistakenly apply a continuous scale to it. Similarly, in academic research, users working with categorical survey data may face this error when they try to apply linear or continuous visualizations.
Feedback from users often points to frustration, especially when handling datasets with mixed data types. Many users report confusion when their data appears numeric in the dataset but is treated as a factor in ggplot, leading to this error.
Solutions to Fix the Error
Let’s walk through some steps to resolve the error in train_continuous(): ! discrete value supplied to a continuous scale.
1. Check Data Types
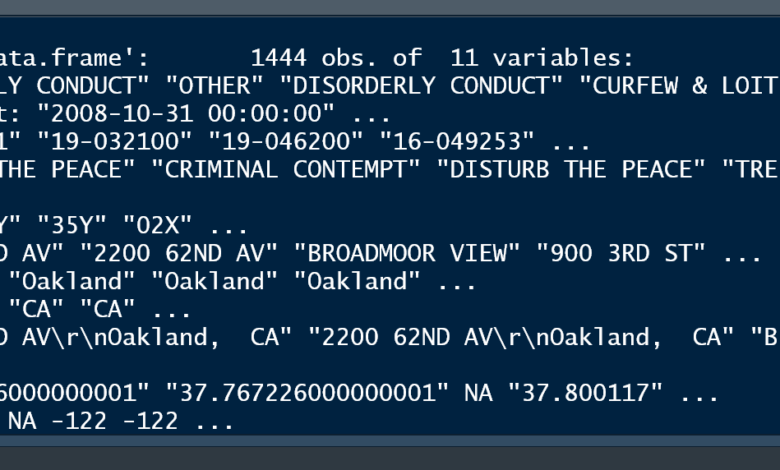
The first step in resolving the issue is to check the data type of the variable in question. This can be done using the str() function in R:
str(data$category)
If the variable is a factor or character, and you expect it to be numeric, you will need to convert it.
2. Convert Data to the Correct Type
If your variable is discrete but needs to be treated as continuous, you can convert it using as.numeric() or as.integer():
data$category <- as.numeric(data$category)
On the other hand, if you are working with truly categorical data, and you mistakenly applied a continuous scale, you’ll need to change the scale function. Instead of scale_x_continuous(), use scale_x_discrete() for discrete data:
ggplot(data, aes(x = category, y = value)) +
  geom_line() +
  scale_x_discrete()
Key Moment: Always match the scale to the data type. Discrete data should use discrete scales, while continuous data requires continuous scales.
3. Use Appropriate ggplot2 Functions
If you are plotting categorical variables (like factors or character strings), make sure to use ggplot2 functions that cater to discrete data:
- For X-axis: Use
scale_x_discrete() - For Y-axis: Use
scale_y_discrete()
Example:
ggplot(data, aes(x = category, y = value)) +
  geom_bar(stat = "identity") +
  scale_x_discrete()
4. Avoid Automatic Conversion Pitfalls
R sometimes automatically converts data types. For instance, when reading a dataset, factors may be introduced where you expect continuous values. Use the stringsAsFactors = FALSE argument when reading data:
data <- read.csv("data.csv", stringsAsFactors = FALSE)
This step can help prevent unexpected conversions that lead to the error in train_continuous(): ! discrete value supplied to a continuous scale.
5. Inspect ggplot Layers
In some cases, the error arises from a mismatch between different layers in the ggplot. For example, you might be trying to overlay a line plot (which expects continuous data) over a bar chart (which uses discrete data). Ensure that all layers use the correct scale for the data they plot.
Preventing Similar Issues in the Future
To avoid encountering the error in train_continuous(): ! discrete value supplied to a continuous scale and similar issues in the future, consider the following best practices:
- Check Data Types Regularly: Before plotting, always verify the structure of your dataset using
str()orsummary()functions. This helps ensure your data types align with your visualization goals. - Explicit Type Conversion: Convert variables to the appropriate type before plotting. This avoids the automatic handling that R sometimes does, which can lead to confusion.
- Use the Right Scale Functions: Remember, continuous data requires continuous scales, while discrete data needs discrete scales. Always use the appropriate scale functions in ggplot2 to prevent errors.
- Test Incrementally: Build ggplot2 visualizations step by step, adding one layer at a time. This helps identify which part of your plot may be causing an issue.
- Data Cleaning: Pay attention to data cleaning steps, especially when dealing with mixed data types. Ensure that your final dataset reflects the types you intend to work with during visualization.


